To implement GA4 on mobile apps, developers are directed to use the Firebase Analytics SDK, which is a free analytics solution offered by Google that integrates with GA4. The Firebase Analytics SDK provides a variety of tools and features to help developers track user behavior, including tracking screen views, events, and user properties. However, the way GA4 is implemented with Firebase SDK differs significantly from how it’s done on the web. Even though there are Google Tag Manager versions for both iOS and Android, they are drastically limited and not very convenient to use. The freedom that GTM and custom JavaScript provide on websites is in a league of its own. To pour salt in the wound, testing and debugging your GA4 events with Firebase Analytics SDK — especially on iOS — is one of the biggest pains.
DebugView
Firebase Analytics / GA4 DebugView enables you to see the events and user properties sent by your app on development devices in near real-time. This is actually a great tool and in many ways a big improvement from Universal Analytics. However, using DebugView is only possible with development versions of your app since enabling it requires special command line arguments or settings.
On Android you need to have Android Studio installed and connect the Android device to your PC with a USB cable. Then you need to run an adb command in the terminal (also Android Studio has a “Terminal” tab) to enable DebugView:
1
$ adb shell setprop debug.firebase.analytics.app PACKAGE_NAME
Replace PACKAGE_NAME with the package name of your app. For example, com.my.app.
While on Android the DebugView can be enabled also when the app has been installed from an online source (e.g. Play Store internal tester distribution), on iOS you need to specify a command line argument in Xcode when building the app from source its source code:
1
-FIRDebugEnabled
In other words, if an iOS test app is distributed through TestFlight, which means that the test version may have a larger audience, it may not be feasible to enable DebugView.
Using an HTTP Proxy
With Universal Analytics it was relatively easy to view the HTTP traffic from the app to Google Analytics servers by using an HTTP Proxy. The proxy software — such as Charles — logs all HTTP / HTTPS traffic between your computer and the internet and displays the requests, responses and HTTP headers (including cookies). The Universal Analytics events were sent to ssl.google-analytics.com in a GET or POST request containing all parameters and dimensions in simple query string format.
app-measurement.com and app-analytics-services.com
Firebase SDK, on the other hand, sends GA4 events to its own servers (app-analytics-services.com and/or app-measurement.com) in a format that’s much harder to read.
At first the raw data looks like a bunch of random characters:
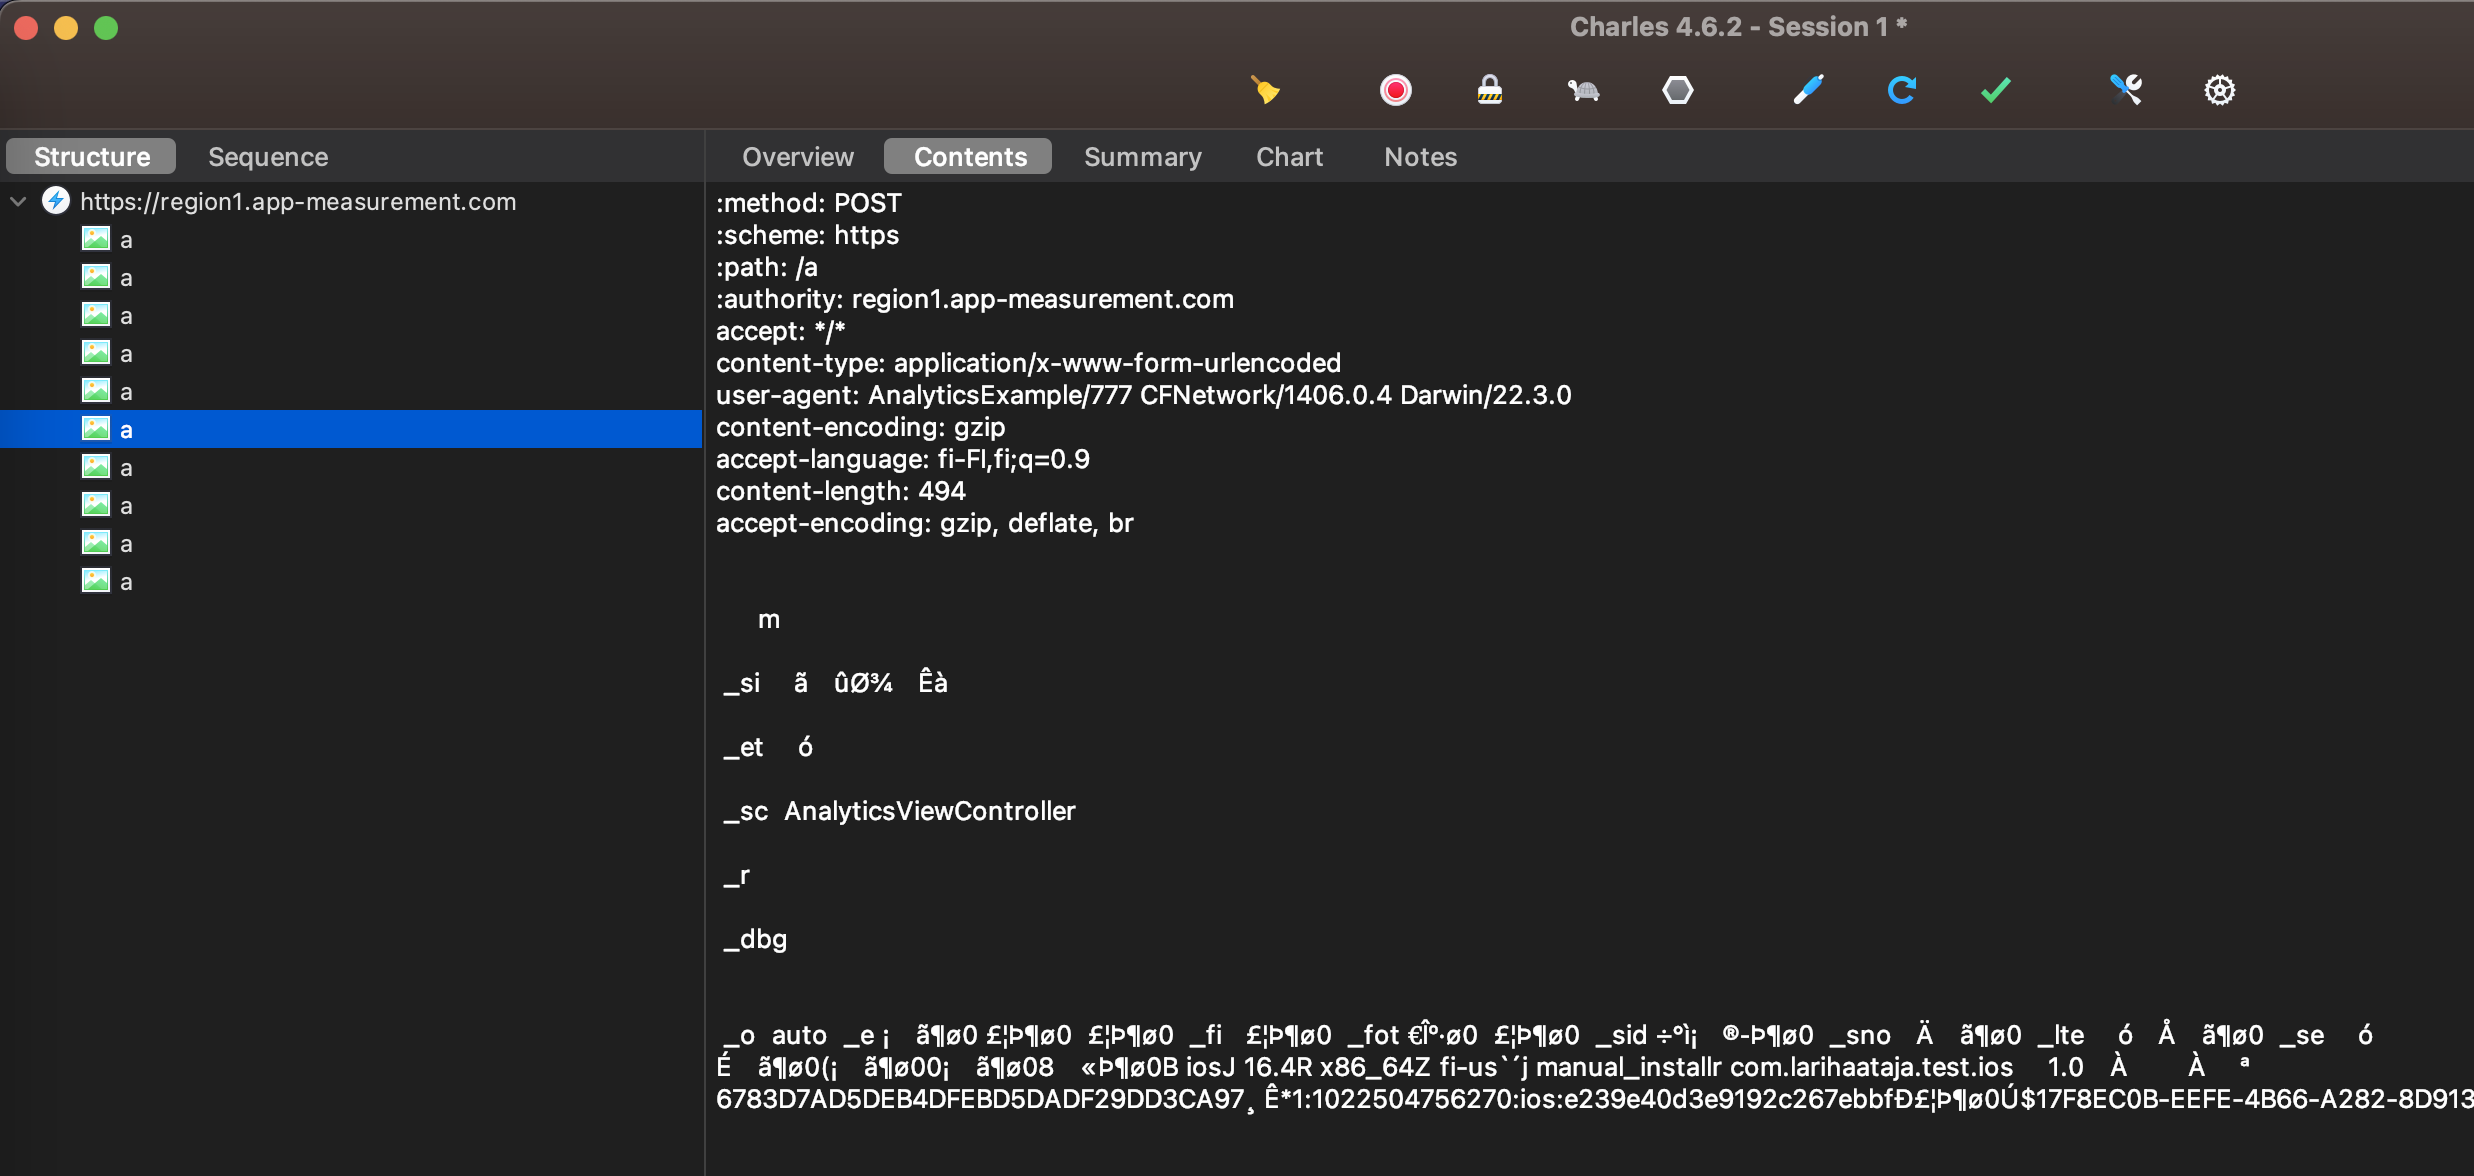
Protocol Buffers
At first, it looks like the content is heavily compressed and / or encrypted somehow but it’s actually using Protocol buffers (“Protobuf”), which is a mechanism develop by Google for serializing structured data — kind of like XML or JSON. Luckily Charles support Protobuf out of the box. You can just right click on the request and select View Request As / Protocol Buffers....

The data is a lot easier to read now but it’s still lacking a lot of information. Protobuf compresses the data heavily by replacing long key names with numbers. The mapping is defined in a .proto file that is needed both when writing or reading Protocol buffers.
Reverse Engineering the Protobuf Definitions
Unfortunately the .proto definitions are not included in the public source code of Firebase SDK and thus are not available anywhere. After looking at the encoded data for a while and connecting pieces of information from other sources, it’s actually relatively simple to unravel the names of most keys in the data structure.
One of the greatest sources for this information are Android logs. On iOS you can see the individual events and user properties in device logs but not the whole request body uploaded to Firebase servers. On Android, on the other hand, Firebase SDK logs the full request body it sends in a human readable format.
First, you need to enable verbose logging for FA-SVC tag by running an adb command in the terminal (also Android Studio has a “Terminal” tab):
1
$ adb shell setprop log.tag.FA-SVC VERBOSE
After generating some events in your app and waiting for a while the app will upload the data to Firebase and log everything. Here’s a what it looks like (I’ve masked some of the data):
1
2
3
4
5
6
7
8
9
10
11
12
13
14
15
16
17
18
19
20
21
22
23
24
25
26
27
28
29
30
31
32
33
34
35
36
37
38
39
40
41
42
43
44
45
46
47
48
49
50
51
52
53
54
55
56
57
58
59
60
61
62
63
64
65
66
67
68
69
70
71
72
73
74
75
76
77
FA-SVC com.google.android.gms V Uploading data. app, uncompressed size, data: com.my.app, 9332,
batch {
  bundle {
    protocol_version: 1
    platform: android
    gmp_version: 46000
    uploading_gmp_version: 19056
    dynamite_version: 55
    config_version: 1679644809123456
    gmp_app_id: 1:123456789:android:aaaaaaaaaa
    admob_app_id:
    app_id: com.my.app
    app_version: 1.0.0
    app_version_major: 100
    firebase_instance_id: xx_xxxx_xx
    dev_cert_hash: -12313123123
    app_store:
    upload_timestamp_millis: 1681470819289
    start_timestamp_millis: 1681468977430
    end_timestamp_millis: 1681469192488
    previous_bundle_start_timestamp_millis: 1681468790498
    previous_bundle_end_timestamp_millis: 1681468884140
    app_instance_id: f8s9fa09vsa4a4lk2983fsdf
    resettable_device_id: aaaaaaaa-aaaa-aaaa-aaaa-aaaaaaaaaaaa
    device_id:
    ds_id:
    limited_ad_tracking: false
    os_version: 9
    device_model: SM-J530F
    user_default_language: fi-fi
    time_zone_offset_minutes: 180
    bundle_sequential_index: 31
    service_upload: true
    health_monitor:
    user_property {
      set_timestamp_millis: 1631520687985
      name: first_open_time(_fot)
      string_value:
      int_value: 1631523600000
    }
    user_property {
      set_timestamp_millis: 1631520687985
      name: first_open_after_install(_fi)
      string_value:
      int_value: 1
    }
    user_property {
      set_timestamp_millis: 1681468712345
      name: ga_session_id(_sid)
      string_value:
      int_value: 1681468788
    }
    event {
      name: user_engagement(_e)
      timestamp_millis: 1681468977430
      previous_timestamp_millis: 1681468884057
      param {
        name: ga_event_origin(_o)
        string_value: auto
      }
      param {
        name: engagement_time_msec(_et)
        string_value:
        int_value: 90654
      }
      param {
        name: ga_screen_class(_sc)
        string_value: MyViewController
      }
      param {
        name: ga_screen_id(_si)
        string_value:
        int_value: -13918239812398123
      }
    }
  }
}
The data is clearly in the same format but just decoded into the original keys. Thus, we can use this to translate many of the numbers in the encoded format to their human readable names.
E.g. at the first level we have “batch” (root message type), and number 1 inside batch is “bundle”. Number 2 in bundle is clearly “event” and so on. Here are some of the clear matches that can be identified:
1
2
3
4
5
6
7
8
9
10
11
12
13
root:    batch
1:       bundle
1.2:     event
1.2.1:   param
1.2.1.1: name (param)
1.2.1.2: string_value
1.2.1.3: int_value
1.2.2:   name (event)
1.3:     user_property
1.3.1:   set_timestamp_millis
1.3.2:   name (user_property)
1.3.3:   string_value
1.3.4:   int_value
You can probably see the pattern?
Now we just need to create a matching .proto file and add it to Charles in order to see the decoded values. Here’s what I’ve managed to figure out by connecting the dots from device logs and BigQuery Exports:
1
2
3
4
5
6
7
8
9
10
11
12
13
14
15
16
17
18
19
20
21
22
23
24
25
26
27
28
29
30
31
32
33
34
35
36
37
38
39
40
41
42
43
44
45
46
47
48
49
50
51
52
53
54
55
56
57
58
59
60
61
62
63
64
65
66
67
68
69
70
71
72
73
74
75
76
77
78
79
// For the most up-to-date version of this Protocol buffers definition,
// check out the GitHub repository:
// https://github.com/lari/firebase-ga4-app-measurement-protobuf

syntax = "proto3";

package app_measurement;

message Bundle {
    int32 protocol_version = 1;
    message Event {
        message EventParameter {
            string name = 1;
            string string_value = 2;
            int64 int_value = 3;
        }
        repeated EventParameter param = 1;
        string name = 2;
        int64 timestamp_millis = 3;
        int64 previous_timestamp_millis = 4;

    }
    repeated Event event = 2;

    message UserProperty {
        int64 set_timestamp_millis = 1;
        string name = 2;
        string string_value = 3;
        int64 int_value = 4;
    }
    repeated UserProperty user_property = 3;

    int64 upload_timestamp_millis = 4;
    int64 start_timestamp_millis = 5;
    int64 end_timestamp_millis = 6;
    int64 previous_bundle_end_timestamp_millis = 7;

    string platform = 8;
    string operating_system_version = 9;
    string device_model = 10;

    string user_default_language = 11;

    int32 time_zone_offset_minutes = 12;
    string install_source = 13;
    string app_id = 14;

    string app_version = 16;

    int32 gmp_version = 17;
    int32 uploading_gmp_version = 18;

    // 20 unknown, example values: "1"

    string app_instance_id = 21;

    int32 bundle_sequential_index = 23;

    string gmp_app_id = 25;

    int64 previous_bundle_start_timestamp_millis = 26;

    string resettable_device_id = 27; // Android ID or IDFV

    string firebase_instance_id = 30;

    int32 app_version_major = 31;

    int64 config_version = 35;

    // 52 unknown, example values: "G1--"
    // 53 unknown, example values: "2"
    // 64 unknown, example values: "google_signals"

}

message Batch {
    repeated Bundle bundle = 1;
}
Next we need to convert this into a “descriptor” that can be added to Charles. If our Protobuf definition file is called app-measurement.proto, we can run the following command to generate a descriptor file called app-measurement.desc. You of course need to have the Protocol compiler installed.
1
$ protoc --descriptor_set_out=app-measurement.desc app-measurement.proto
In case you only need the descriptor file, I’ve shared the .proto and .desc files in a GitHub repo where you can downloaded them.
Viewing Decoded app-measurement.com / app-analytics-services.com Requests in Charles
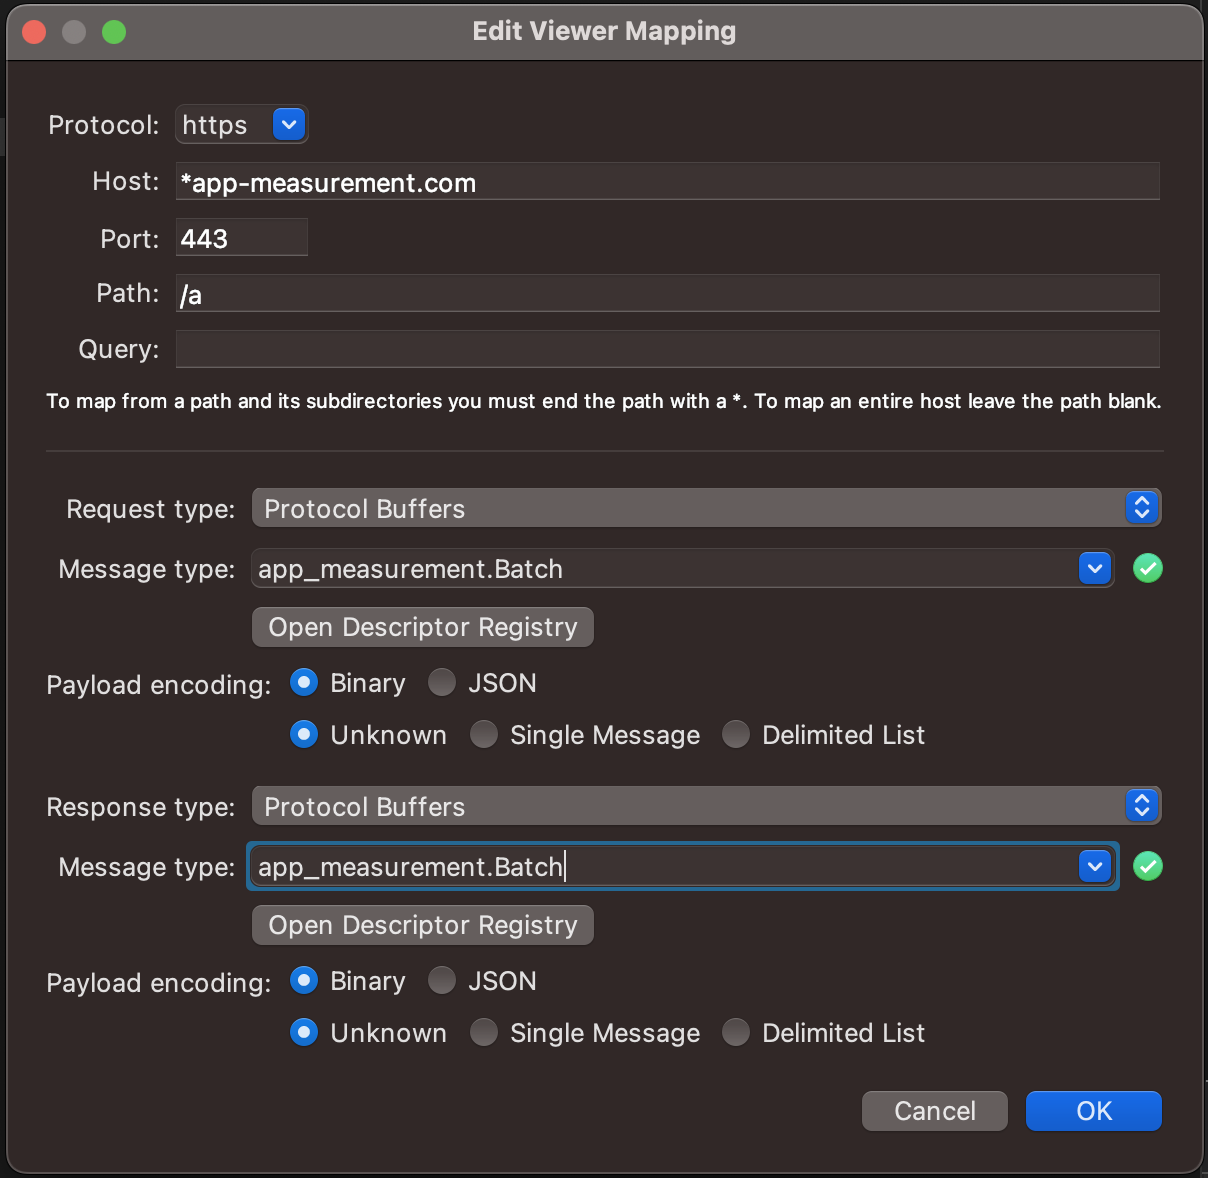
Now that we have a descriptor file for the Protocol buffers, we can add it to Charles and set up a viewer mapping for app-analytics-services.com and/or app-measurement.com requests. Viewer mappings are a way to tell Charles how to decode the data in a request so that you don’t have to select the “View Request As” menu every time you want to see the decoded data.
From view menu open Viewer mappings... and add a new mapping. You need to add the app-measurement.desc to the Descriptor Registry and then add a new mapping for app-analytics-services.com and/or app-measurement.com requests with the following settings:
- Request type:
Protocol Buffers - Message type:
app_measurement.Batch - Payload encoding:
Binary&Unknown
If you view the app-analytics-services.com / app-measurement.com requests now you should start to see values that make a lot more sense.

Many of the default event, event parameter and user property names are still shortened but luckily their actual values can be also seen in the Android and iOS device logs and most of them seem to be quite obvious abbreviation that are easy to learn even from memory.
Event names:
1
2
3
4
5
_s = session_start
_e = user_engagement
_vs = screen_view
_ab = app background ?
_au = app update ?
Event parameter names:
1
2
3
4
5
6
7
8
9
10
11
12
_si  = ga_screen_id
_et  = engagement_time_msec
_sc  = ga_screen_class
_sn  = screen name
_o   = ga_event_origin
_pc  = previous view controller
_pv  = previous app version
_err = error
_ev  = error parameter
_el  = error code?
_r   = realtime
_dbg = ga_debug
User property names:
1
2
3
4
5
6
_fi  = first_open_after_install
_fot = first_open_time
_sid = ga_session_id
_sno = ga_session_number
_lte = lifetime_user_engagement (time in ms)
_se  = session_user_engagement (time in ms)
I have added these to the same GitHub repo and in case you come accross values that are missing, feel free to open an issue in GitHub or, even better, create a pull request with the values that you figured out yourself.
Conclusions
In today’s privacy landscape, it’s essential that an app’s publisher knows what data the app collects and how it’s processed. The way GA4 is implemented with Firebase SDK does not meet this regulatory requirement. Even though the DebugView is a welcome addition to the GA4 toolbox, it unfortunately does not reveal all of the parameters collected by Firebase Analytics. The lack of documentation and proper tooling for testing and debugging makes GA4 a less attractive choice when implementing analytics in native mobile apps. The fact that there might even be a distant need to “reverse engineer” an SDK added to the app, is an indication that openness, transparency and developer experience are not a priority for Google. At a minimum, Google should publish the full protocol buffers definition used by Firebase Analytics. In the meanwhile, I hope this blog post and the GitHub repository shed some light on the inner workings of Firebase Analytics and GA4, and bridge the gap in our knowledge on the subject.